



By Jim Shimabukuro (assisted by ChatGPT)
Editor
What are the actual statistics for “nontraditional students”? The majority claim is decades old, but the pressures it describes are visible in the current muddle of student data.

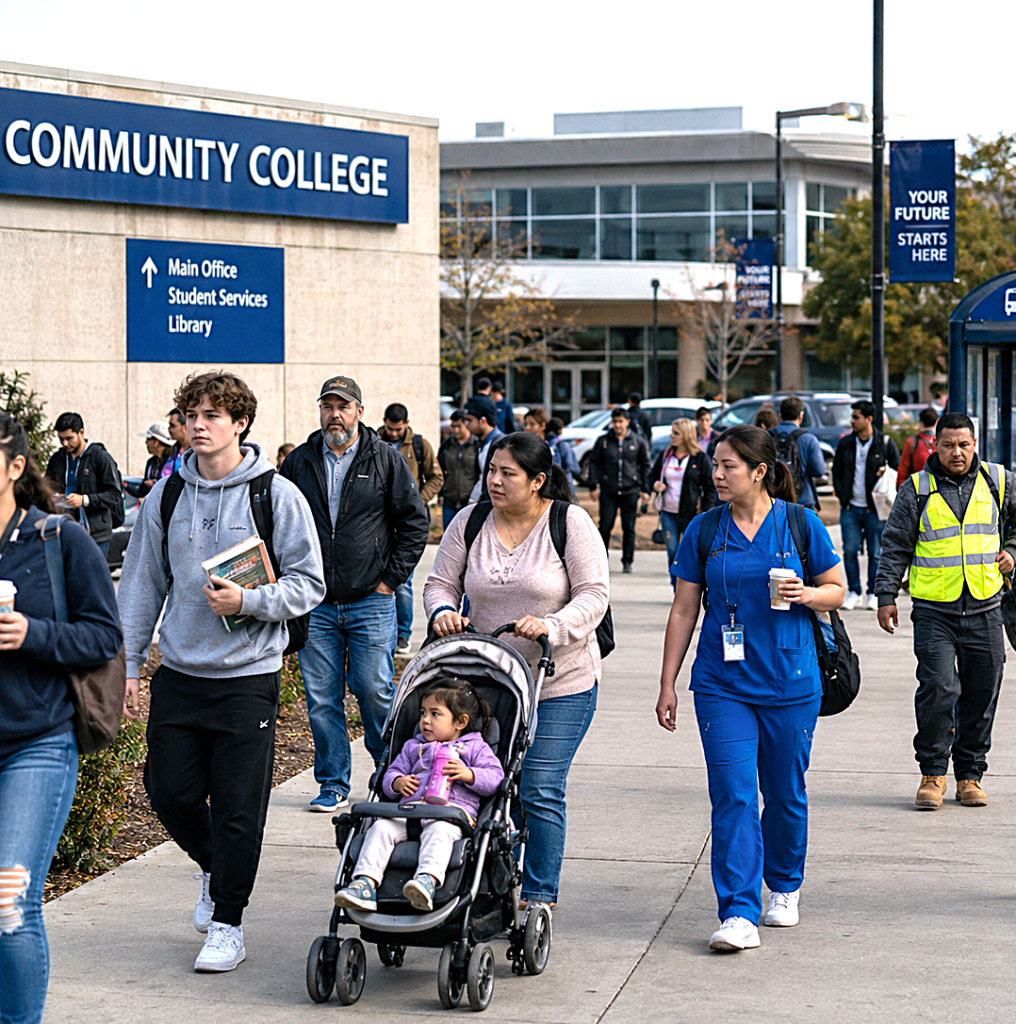
A student can be 19, enrolled full time, and still work enough hours to miss a tutoring appointment. Another can be 38, taking one online course after putting children to bed. A third may have transferred twice and lost credits at each move. Colleges often put all three under the label “nontraditional.” That label describes a real mismatch between students’ lives and college routines, but it does not tell us how many such students are enrolled in September 2026. The strongest conclusion is more useful than a slogan: by a broad definition, students outside the old full-time, straight-from-high-school pattern have long been the majority. By age alone, adults 25 and older remain a minority of undergraduates. Higher education should design around the actual demands on students’ time and money, then use AI where it can remove specific barriers to progress.
Joshua Bay’s September 24 conversation with Bryan Ashton of Trellis Strategies asks whether “nontraditional” still makes sense when these experiences have become common. Ashton says that “even the traditional students are having characteristics of what we would traditionally call nontraditional” (Bay, 2026c). His point concerns the lives students lead. It should be tested against enrollment data before it becomes a claim about a numerical majority.
The best-known majority figure comes from a National Center for Education Statistics study of undergraduates in 2011–12. Seventy-four percent had at least one nontraditional characteristic, and about 24 percent had four or more (Radford et al., 2015). The study considered such features as delayed enrollment, part-time attendance, full-time employment, financial independence, dependents, single parenthood, and a nonstandard route through high school. A 20-year-old who entered immediately after high school could qualify through part-time study or substantial work. The 74 percent figure therefore counts circumstances, not the number of students over 25. It is also a measure from fourteen academic years ago, although it still circulates in present-tense claims.
An age comparison reaches a different answer. In a published breakdown of spring 2025 undergraduate enrollment, about 66 percent were ages 18 to 24 and another 10 percent were 17 or younger, including many students taking college classes while still in high school. The remaining roughly 24 percent were 25 or older—about 3.7 million of the 15.3 million undergraduates in that term. Those figures are approximate because the published age shares are rounded (Welding et al., 2025). Counting the high school students as part of the under-25 group makes clear why an age-only definition cannot establish an adult majority.
The latest comprehensive enrollment releases provide a more current picture of scale. The National Student Clearinghouse Research Center estimated 16.2 million undergraduates in fall 2025 and 15.5 million in spring 2026 (National Student Clearinghouse Research Center [NSCRC], 2026a, 2026b). Fall and spring are different terms, so the two totals should not be read as a year-over-year loss of 700,000 students. Neither headline total reports a single mutually exclusive “traditional” versus “nontraditional” count. Bay’s article likewise groups adult learners, working students, parents, transfer students, and first-generation students under one umbrella without calculating their union. A person can belong to several of those groups at once (Bay, 2026c).
The honest 2026 answer is consequently bounded. The historic broad definition produced a clear majority; the more recent age breakdown produced a clear minority of students 25 and older. A fresh national percentage using the same broad, combined definition has not been established by these current enrollment releases. Repeating 74 percent as a measured 2026 share would give an old result a new date.
Work and care cross the age boundary
Trellis’s Student Financial Wellness Survey supplies a recent view of the schedules behind that distinction. Its fall 2025 survey reached 65,816 undergraduate respondents at 153 participating institutions in 23 states. About two-thirds reported working for pay. Among respondents who worked, 34 percent identified more as workers who went to school than as students who worked. Seventeen percent of undergraduate respondents were caregivers or guardians to children or other dependents (Trellis Strategies, 2026). These are weighted findings for the participating colleges, with a 7.8 percent response rate; they are not a national census and the categories cannot be added together.
The work pattern is telling. In the Trellis survey, 81 percent of employed students studying part time worked at least 20 hours a week, and 44 percent worked 40 or more. Even among employed students attending college full time, 59 percent worked at least 20 hours and 17 percent worked full time. One respondent put the pressure plainly: “a lot of college students have to work more than two jobs to scrape by” (Trellis Strategies, 2026). Some young undergraduates face the same conflicts between shifts and class meetings as older students.
Parenthood concentrates those pressures. A June 2026 Community College Research Center fact sheet estimates about 3.1 million undergraduate parents, roughly one in five, using national studies. Nearly half attend community or technical colleges. Its analysis finds dependent children among nearly 23 percent of public two-year students and 11 percent at public four-year colleges; 59 percent of student parents attend part time, compared with 41 percent of students without children. Among parents entering public two-year colleges, 27 percent earn a credential within six years, versus 41 percent of nonparents (Community College Research Center [CCRC], 2026). The Trellis estimate of 17 percent caregivers or guardians and the roughly one-in-five parent estimate use different data and definitions. Neither should be quietly substituted for the other.
The problem reaches beyond students now enrolled. The Clearinghouse counted 43.1 million people with some college but no credential as of the start of the 2023–24 academic year. That stock includes people outside the working-age population and must not be added to a term’s enrollment. Its size shows why redesign concerns returners as well as current students (NSCRC, 2025). In September 2026 interviews with 50 returning adults, Mathew Bergman described adult learners as “25-to-alive,” a reminder that a single age band contains many circumstances and ambitions (Sanchez, 2026).
The course schedule and sequence
Ashton calls the course schedule an underappreciated intervention. A student who knows only that a required class is offered “next year” cannot decide whether to keep a job shift, pay for childcare, or finish a credential on time. Colleges can publish predictable sequences of required courses, preserve evening and online options where demand supports them, and build an actual part-time path through each program. The sequence should show prerequisites, transfer consequences, costs, and how a missed semester changes the completion date (Bay, 2026c).
This requires more than placing lectures online. CCRC researchers Davis Jenkins, John Fink, and Hana Lahr report that most of the community colleges they studied cannot readily identify which students have a complete educational plan tied to their goals. They argue that colleges can use those plans to schedule courses and identify bottlenecks (Jenkins et al., 2026). A learner who can take a course at midnight still cannot graduate if the next required course appears once a year at 10 a.m. or if a transfer requirement is discovered too late.
Online and hybrid courses have a place in the redesign. CCRC’s 2026 parent fact sheet reports that 26 percent of community college parents take courses exclusively online, compared with 13 percent of nonparents. It also notes research associating online courses for community college students with lower grades and persistence than in-person courses in some settings (CCRC, 2026). Flexible access needs deliberate teaching: clear weekly milestones, prompt feedback, meaningful contact with instructors and peers, and ways to obtain help outside standard office hours. In a 2025 CCRC account of LaGuardia Community College, Susan Bickerstaff suggested reserving several in-person meetings for labs or discussion while moving work that students can do independently online (Kim, 2025). That design protects scarce time together and gives instructors a role that a recording cannot fill.
A college should track where students actually stall: the required course they could not get, the credit that failed to transfer, the form that stayed unanswered, or the change in shift that turned an evening class into an impossibility. Those details give the term “student success” a practical meaning.
Can AI help?
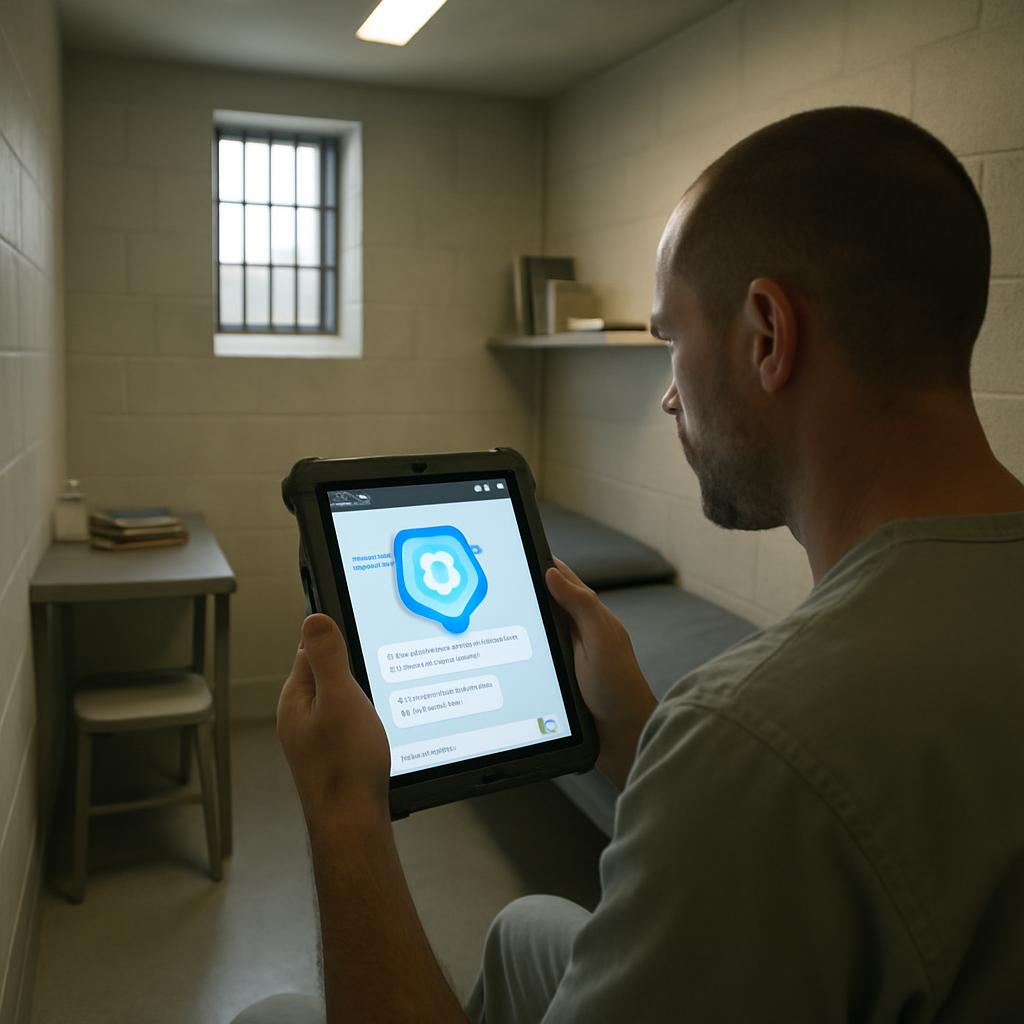
AI can make a complicated system easier to navigate if it uses accurate program rules and hands consequential decisions to accountable people. A student might ask at 5 a.m. which remaining courses satisfy a credential, whether a class is available after a work shift, and what happens to aid after dropping to part-time status. An assistant could retrieve published rules, display the next feasible schedule, flag uncertainty, and offer a direct appointment with an adviser. The college would have to keep its catalog and transfer agreements current, log corrections, and ensure that the same help is available by phone or in person. An AI answer invented from an outdated catalog could cost a student a term.
Austin Community College is testing a more proactive approach. Its planned Digital Twin Initiative would bring together student data and offer support soon after a warning sign such as a poor grade. Chancellor Russell Lowery-Hart describes a sequence in which a student receives options for online or nearby tutoring immediately after the grade posts. The project aims to shorten the wait between identifying trouble and providing help; the September 2026 account reports a design and rollout, not a demonstrated improvement in retention or completion (Bay, 2026a).
The idea addresses a real staffing constraint. In a June 2026 EAB survey of 459 student-success leaders, 60 percent cited budget constraints and 55 percent cited staffing shortages. Fifty-nine percent said AI can handle routine or repetitive interactions while staff contact remains the norm; only 6 percent said AI should handle most interactions (Bay, 2026b). Those are leaders’ assessments, not experimental evidence that any particular AI system improves student outcomes. At Austin, an administrator put the practical limit plainly: “Nothing is going to replace a direct conversation with a student” (Bay, 2026a).
The data that make proactive help possible also require restraint. Combining grades, financial aid, advising notes, and basic-needs information can reveal sensitive details about a student’s life. Colleges should limit access to what an intervention requires, tell students which information is used, check incorrect flags, provide a route to a person, and evaluate whether any system overlooks part-time students, returners, or students with incomplete records. A sensible pilot would compare time to assistance, course completion, excess credits, and continued enrollment against a comparable group. Until those outcomes are observed, a well-designed demonstration remains a promising experiment.
Closing thoughts
Higher education has enough evidence to redesign without pretending it has a precise new majority count. The 2011–12 federal survey documented how uncommon the uninterrupted, financially dependent, full-time path had become. Recent enrollment data show that most undergraduates are still younger than 25. Recent surveys show that employment and caregiving reach across ages and institution types. Each finding measures something different, and together they identify a specific institutional responsibility: make a workable route to completion visible before students commit their time and money.
The test for a redesigned college is straightforward. Can a person see the whole sequence of courses before enrolling? Can a student keep progressing when a child is sick or an employer changes a shift? Can help arrive while a setback is still repairable? AI may shorten a search or an administrative delay, while teachers and advisers attend to learning and difficult decisions. Colleges that answer those questions with evidence from their own students will have earned a better description than “traditional” or “nontraditional”: they will have built programs people can actually complete.
References
Bay, J. (2026a, September 11). Can AI help colleges reach struggling students earlier? Inside Higher Ed. https://www.insidehighered.com/news/student-success/academic-life/2026/09/11/can-ai-help-colleges-reach-struggling-students
Bay, J. (2026b, September 3). Student support needs outpace college capacity. Inside Higher Ed. https://www.insidehighered.com/news/student-success/academic-life/2026/09/03/student-support-needs-outpace-college-capacity
Bay, J. (2026c, September 24). When nontraditional students become the norm. Inside Higher Ed. https://www.insidehighered.com/news/student-success/college-experience/2026/09/24/when-nontraditional-students-become-norm
Community College Research Center. (2026, June). Student parents in community college [Policy fact sheet]. Teachers College, Columbia University. https://ccrc.tc.columbia.edu/publications/student-parents-community-college.html
Jenkins, D., Fink, J., & Lahr, H. (2026, February 25). Most community college students don’t have a plan—here’s a tool and five strategies to help change that. Community College Research Center. https://ccrc.tc.columbia.edu/easyblog/most-community-college-students-dont-have-plan.html
Kim, H. (2025, September 4). Beyond access: Designing community college for real lives. Community College Research Center. https://ccrc.tc.columbia.edu/easyblog/beyond-access-designing-community-college.html
National Student Clearinghouse Research Center. (2025, June 4). Some college, no credential student outcomes: 2025 report for the nation and the states. https://nscresearchcenter.org/some-college-no-credential/
National Student Clearinghouse Research Center. (2026a, January 15). Final fall enrollment trends. https://nscresearchcenter.org/final-fall-enrollment-trends/
National Student Clearinghouse Research Center. (2026b, June 4). Final spring enrollment trends. https://nscresearchcenter.org/final-spring-enrollment-trends/
Radford, A. W., Cominole, M., & Skomsvold, P. (2015). Demographic and enrollment characteristics of nontraditional undergraduates: 2011–12 (NCES 2015-025). National Center for Education Statistics. https://nces.ed.gov/pubs2015/2015025.pdf
Sanchez, O. (2026, September 15). New book chronicles 50 adult learner ‘comeback’ stories. Inside Higher Ed. https://www.insidehighered.com/news/admissions/adult-post-traditional/2026/09/15/new-book-chronicles-50-adult-learner-comeback
Trellis Strategies. (2026, April). Student financial wellness survey: Fall 2025 semester results. https://www.trellisstrategies.org/wp-content/uploads/2026/04/SFWS-Aggregate-Report_FALL2025_FINAL.pdf
Welding, L., & Bryant, J. (2025, August 1). U.S. college enrollment: Trends and statistics. BestColleges. https://www.bestcolleges.com/research/college-enrollment-statistics/
###
Filed under: Uncategorized |














































































































































































































































































































































































































































Leave a Reply