


By Jim Shimabukuro (assisted by Claude)
Editor
In February, ETC Journal published two companion articles on the state of American public schools. The first described a system that was “not in free fall, but it has not fully recovered from the shocks of the pandemic and the political turbulence of the past decade” (Shimabukuro, 2026a). The second traced the decline back to a peak in student achievement in 1967 and closed with a harder judgment: “we’ve been trying to fix a system that may have been fundamentally misaligned with student needs even during its supposed golden age. The factory model worked well enough for an industrial economy, but it’s unclear whether it ever truly served the full range of human learning potential—and it’s certainly inadequate for today’s world” (Shimabukuro, 2026b).
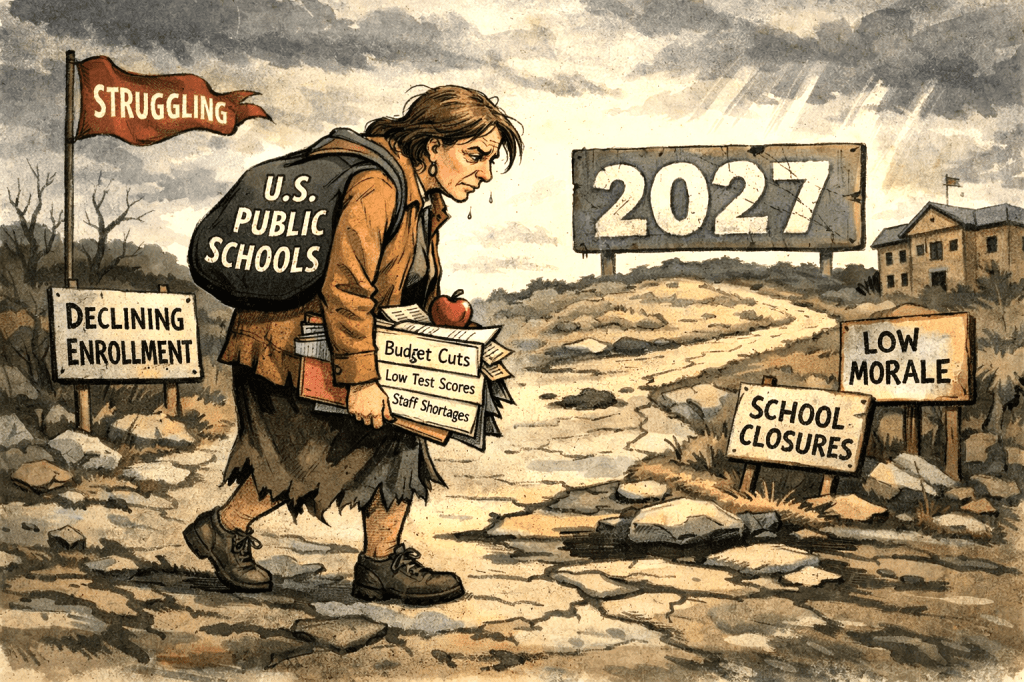
Eight months later, a large batch of new evidence is in. In May, researchers at Harvard and Stanford released the fourth annual Education Scorecard, built on state test data for about 35 million students. In June came the National Assessment of Educational Progress (NAEP) long-term trend results for 9- and 13-year-olds and a new American Enterprise Institute (AEI) report on chronic absenteeism. In July, the Learning Policy Institute updated its count of teacher shortages. On September 8, the Organisation for Economic Co-operation and Development (OECD) released results from PISA 2025, its test of 15-year-olds in 91 countries and economies, and on the same day a Gallup poll found that Americans’ satisfaction with K-12 education had fallen to the lowest level Gallup has recorded. In October, the Treasury Department published rules for a federal tax-credit scholarship program that begins in January, and the Center on Reinventing Public Education (CRPE) published a blueprint for states.
This article compares those results against the February verdict, considers what they mean for the United States at home and in its competition with other nations, and takes up the question the February piece left open: whether the public school model should be repaired or replaced, and if replaced, with what.
What the New Numbers Show
The most hopeful result concerns the youngest students. On the NAEP long-term trend assessment, released June 10, 9-year-olds gained 4 points in both reading and math compared with 2022, and their reading scores returned to pre-pandemic levels (National Assessment Governing Board [NAGB], 2026). These are children who were about to start kindergarten when COVID-19 closed classrooms, so most of their schooling has taken place in person (Altavena, 2026a). Matthew Soldner, acting commissioner of the National Center for Education Statistics, read the result as evidence that “growth can happen again” (Altavena, 2026a).
The same release showed no such movement for 13-year-olds. Their scores were unchanged from 2023, and compared with 2012 they were down 7 points in reading and 15 points in math (Altavena, 2026a). Only 14% of 13-year-olds said they read for fun almost every day, compared with 35% in 1984, and 23% reported taking algebra, compared with 34% in 2012 (NAGB, 2026). Lesley Muldoon, executive director of the board that oversees NAEP, said, “As a nation we have to get to work helping adolescent learners achieve at much higher levels” (NAGB, 2026). Those 13-year-olds follow the high school seniors tested in 2024, whose average reading score was the lowest on any NAEP reading assessment and 45% of whom scored below the “basic” level in math (Meltzer, 2025).
The Education Scorecard, released May 13 by Thomas Kane of Harvard and Sean Reardon of Stanford, supplied the longer view. Its authors date a “learning recession” to 2013. From 1990 to 2013, math achievement for fourth and eighth graders rose steadily; Reardon noted that “the average fourth grader in 2013 could perform the same math skills as the average sixth grader could in 1990” (Turner, 2026). After 2013 the line turned down. Between 2022 and 2025 most states improved in math, but only Louisiana returned to its 2019 performance in both math and reading, and no state has returned to its 2013 level (Turner, 2026). The authors point to two developments that coincide with the turn. Around the 2012–13 school year, 38 states received federal waivers from the consequences of No Child Left Behind, and Congress later replaced the law with one that put less weight on test-based accountability. In the same period, teen social media use grew rapidly: about one in four teens said they were online “almost constantly” in 2014–15, and nearly half said so by 2022 (Turner, 2026). Kane summarized the sequence this way: “The pandemic was the mudslide that followed seven years of erosion in student achievement” (Harvard Center for Education Policy Research [CEPR], 2026).
PISA 2025 placed the American numbers in a global frame. U.S. 15-year-olds averaged 490 in reading and 463 in math (Mesa, 2026). Reading fell 14 points from 2022; math slipped 2 points from 2022 and stands 15 points below 2018 (Mahnken, 2026). Chalkbeat’s reporters put it plainly: “Even U.S. PISA scores in math and reading are at or near their lowest level” (Barnum & Meltzer, 2026). The United States rose in the rankings anyway, because most other countries fell faster. Average math and reading results across all participants were the lowest PISA has recorded, and over the past decade average reading performance fell by the equivalent of a year and a half of schooling (Mahnken, 2026). The exceptions to the global slide were few: Singapore, Taiwan, Japan, England, and Estonia (Mahnken, 2026). Inside the United States, the distance between strong and weak students kept growing. The gap between students at the 90th and 10th percentiles in reading grew by 50 points since 2015 (Mahnken, 2026). Michael Petrilli, president of the Thomas B. Fordham Institute, called the scores “alarming” and added, “The fact that other advanced nations are also seeing declines, especially in reading, is cold comfort” (Mahnken, 2026).
The U.S. PISA data come with a warning attached. Because of incomplete responses from schools, the OECD said it “is not possible to rule out bias in PISA performance results, nor to determine its most likely direction,” and more than 40% of U.S. test-takers did not complete the background questionnaire, so the results cannot be broken out by family income or race (Barnum & Meltzer, 2026). The Education Department attributed part of the problem to a month-long pause in PISA activity in the spring of 2025 (Barnum & Meltzer, 2026).
Attendance, the most basic input in schooling, has barely moved. AEI’s June report found that 22.6% of students in 44 states and the District of Columbia were chronically absent in 2024–25, meaning they missed at least 10% of the school year. That is down from 23.5% the year before and from a peak of 28.3% in 2022, but well above the 15% rate the U.S. Department of Education called a “hidden educational crisis” in 2016 (Altavena, 2026b). Kindergarten absenteeism in 2025 was 48% higher than in 2019. When students were asked why they missed school, 32% cited a family vacation or event and 16% said they “just didn’t want to go” (Altavena, 2026b). The report’s author, AEI senior fellow Nat Malkus, described the public’s attitude: “Everyone agrees it’s a problem, and they seem to agree that it’s somebody else’s problem” (Altavena, 2026b). In New York City, the nation’s largest district, 33.5% of students were chronically absent in 2025–26, unchanged from the prior year and well above the roughly one in four before the pandemic (Zimmer, 2026).
The teacher workforce has not recovered either. The Learning Policy Institute’s July update counted 387,843 teachers who were not fully certified for their assignments and 37,569 unfilled positions in the 29 states and the District of Columbia that report vacancies. Together, at least 425,412 positions, about one in eight nationally, were vacant or held by teachers without full certification for the job (Learning Policy Institute, 2026). In February, the estimate ETC cited was about 366,000 under-certified teachers in 48 states and the District of Columbia (Shimabukuro, 2026a).
Enrollment continues to fall. Public school enrollment nationally dropped 2.3%, or 1.18 million students, over five years, and federal projections show another 2.7 million lost by 2031 (Lambert et al., 2026). California lost 74,961 students in a single year, its largest drop since 2021–22 and more than seven times the state’s own forecast; state officials attributed part of the loss to immigration enforcement (Lambert et al., 2026). In Florida, where every family is eligible for a state-funded voucher, enrollment in Duval County’s traditional public schools fell below 100,000 for the first time in the district’s modern history, while the number of Duval students using vouchers rose from about 3,000 in 2015 to about 29,000 (Webster-Bass, 2026). “All of the state’s funding formula is ultimately tied to enrollment,” a Duval district official told the Florida Trib (Webster-Bass, 2026). The losses are turning into closures. A K-12 Dive tracker lists about 159 schools in 16 districts approved for closure, consolidation, or repurposing since November 2025, including 29 in Cleveland, 17 in Philadelphia, and 12 each in Houston and Pittsburgh. Cleveland’s enrollment has fallen from about 70,000 in 2004 to 34,000 (Merod, 2026).
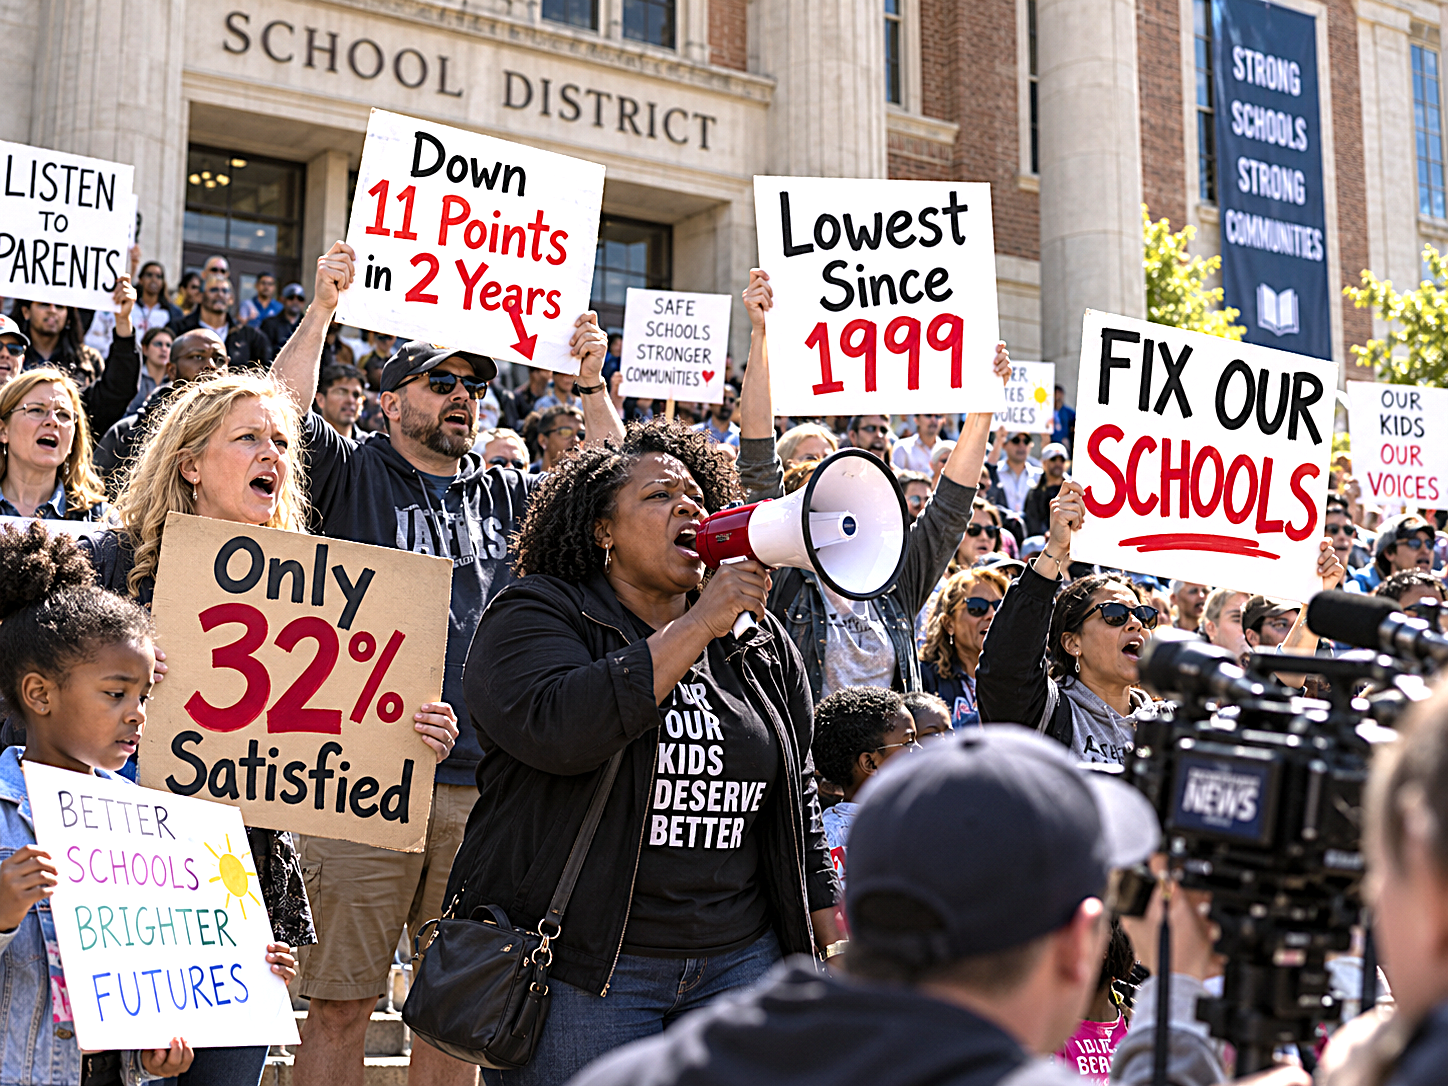
Public confidence has fallen with the numbers. In a Gallup and Walton Family Foundation poll taken in August, “Just 32% of American adults say they are ‘completely’ or ‘somewhat’ satisfied with the U.S. school system,” down 11 points in two years and the lowest since Gallup began asking in 1999. Only about two in ten said schools do a good or excellent job teaching critical thinking or preparing students for work (Associated Press, 2026). Jack Schneider, a historian of education at the University of Massachusetts Amherst, said, “It’s terrifying. We’re on the precipice of the dissolution of the public education system as we have known it” (Associated Press, 2026).
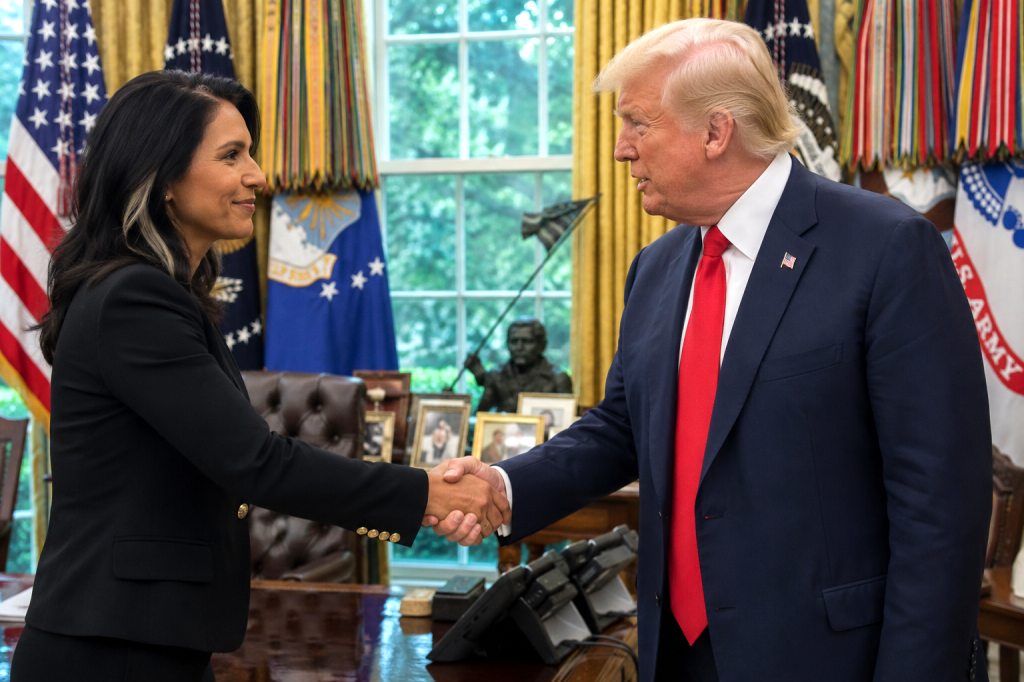
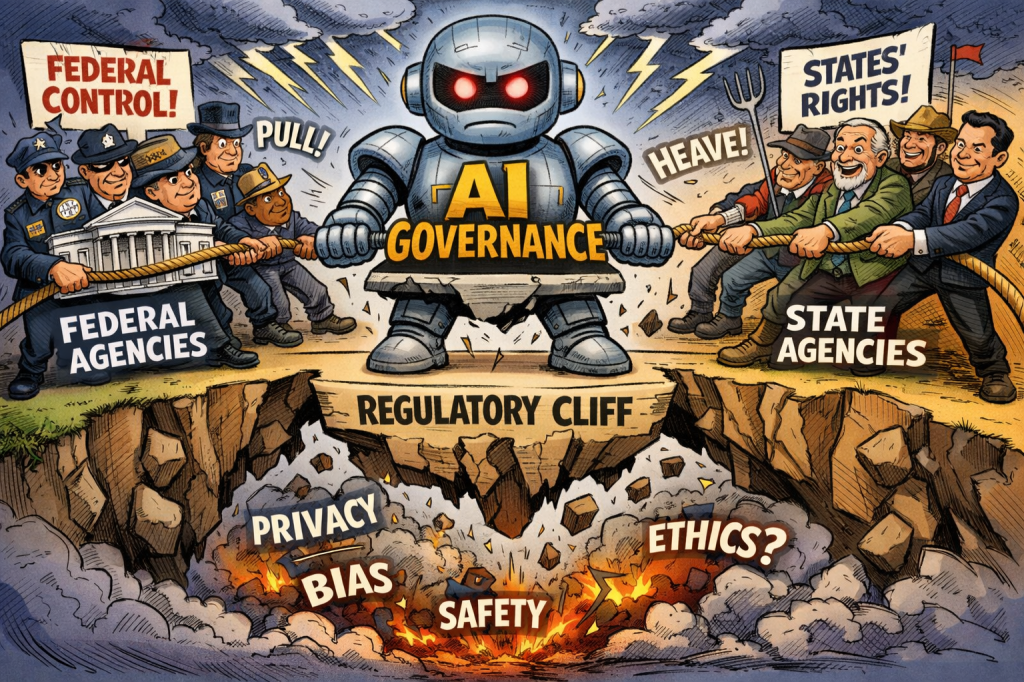
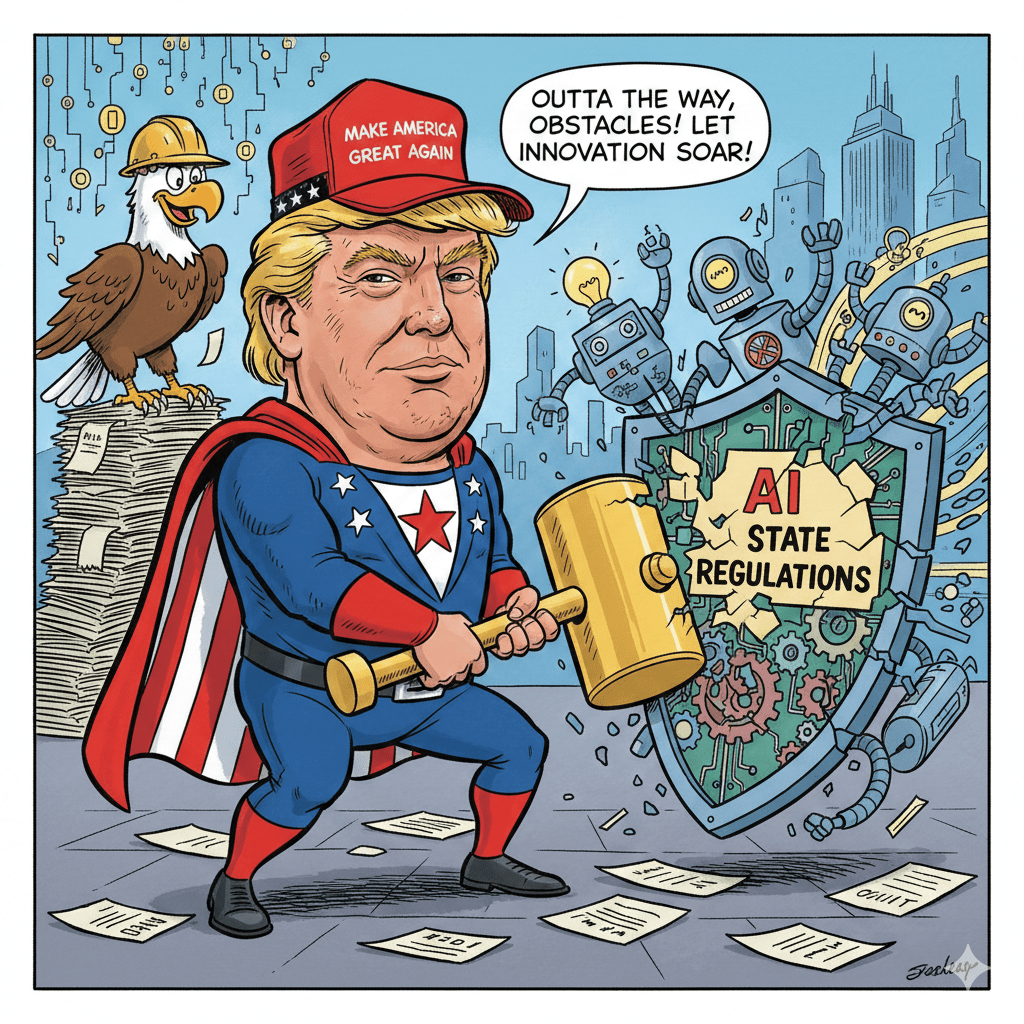
Federal policy has also changed. The U.S. Department of Education has laid off nearly half its workforce and moved more than 100 programs and obligations to other agencies, including the Departments of Labor and Health and Human Services (Work, 2026). Staff who oversee Title I, the $18.4 billion program for high-poverty schools, now work for Labor, and a Government Accountability Office report found the department spent as much as $38 million paying laid-off staff not to work between March and December 2025 (Mehta & Turner, 2026). Education Secretary Linda McMahon defends the dispersal as “my proof of concept” (Work, 2026). Meanwhile, the federal tax-credit scholarship program created in the 2025 federal tax law takes effect January 1, 2027. Taxpayers can claim a dollar-for-dollar federal credit of up to $1,700 for donations to scholarship organizations, 31 states have opted in, and the IRS projects the program “could grow to $26 billion in 2030” in the 30 states that joined before October 1, serving at least 2 million students. For comparison, Title I totaled $18.4 billion in 2026 (Stone & Prothero, 2026). New York’s Democratic governor, Kathy Hochul, joined in October, saying, “I’m not going to leave money on the table when it could help our kids” (Stone & Prothero, 2026).
Rereading the February Verdict
Much of the February analysis holds up. The decline did begin before the pandemic; the Scorecard now dates it to 2013, and the long-term trend data for 13-year-olds show losses that predate 2020. The gaps between stronger and weaker students are widening, as the February piece said they were. Families with means continue to leave: in February, ETC reported that public middle-school enrollment in Massachusetts was down almost 8% in fall 2024, with the largest losses among high-income families (Shimabukuro, 2026b). Absenteeism has hardened into a habit.
Three findings from the past eight months complicate the February conclusion, however. The first concerns the record before 2013. The February epilogue suggested the public school model “may have been fundamentally misaligned with student needs even during its supposed golden age.” The Scorecard shows that between 1990 and 2013 the same system, with the same age-graded classrooms, bell schedules, and district governance, produced roughly two grade levels of improvement in fourth-grade math. “Racial gaps were narrowing too,” Kane said (Turner, 2026). Reardon added, “It’s easy to be sort of doom and gloom,” but “when you look at the period from the ’90s through 2013, we made enormous gains” (Turner, 2026). That record is difficult to square with a model that never worked.
The second concerns recovery since 2022. Every state that gained in reading between 2022 and 2025, seven states plus the District of Columbia, had adopted comprehensive “science of reading” reforms, which emphasize phonics and systematic instruction in decoding; no state without such reforms by January 2024 improved in reading (Turner, 2026). The researchers describe the link as clear but not proven to be causal. Mississippi passed a 2013 law requiring phonics-based reading instruction and placing reading coaches in schools across the state, and in 2026 it extended the initiative into higher grades and passed a math act modeled on it (Bose et al., 2026). Tennessee ranked second of 38 states in math growth and fourth of 35 in reading, crediting early literacy reforms, high-quality instructional materials, summer camps, and tutoring (Tennessee Department of Education, 2026). In Baltimore, where the district adopted phonics-based instruction in 2016 under chief executive Sonja Brookins Santelises, reading scores have climbed back to about their 2017 level (Turner, 2026). Federal money mattered: “If it hadn’t been for the federal pandemic relief,” Kane said, “we estimate there would have been no recovery on average for the highest-poverty districts” (Turner, 2026). These districts used ordinary public school tools: a curriculum, coaching for teachers, tutoring, and more time.
The third concerns the rest of the world. The February piece attributed the American decline mainly to American causes: union influence, governance, property-tax limits, polarization. PISA 2025 shows math and reading falling in most of 91 systems, which differ widely in how they govern, fund, and staff their schools. “There’s an ongoing global decline, and it seems like the pandemic has a long, long tail,” said Tracey Burns of the National Center on Education and the Economy (Barnum & Meltzer, 2026). The OECD’s Andreas Schleicher said learning outcomes “have stagnated or declined in many countries, in some cases for well over a decade” (Barnum & Meltzer, 2026). A decline that crosses so many systems at once points to shared causes, such as smartphones, social media, the pandemic, and now generative AI, in addition to the national ones.
There is also a dispute among historians about the factory label itself. Schneider argued a decade ago that the story of schools modeled on factories is “an invented history full of errors and omissions” (Schneider, 2015). The label is imprecise as history. It still points to real features of the system: students grouped by birth year, credit earned by time in a seat, a fixed daily schedule, and homework and tests as the main evidence of learning.
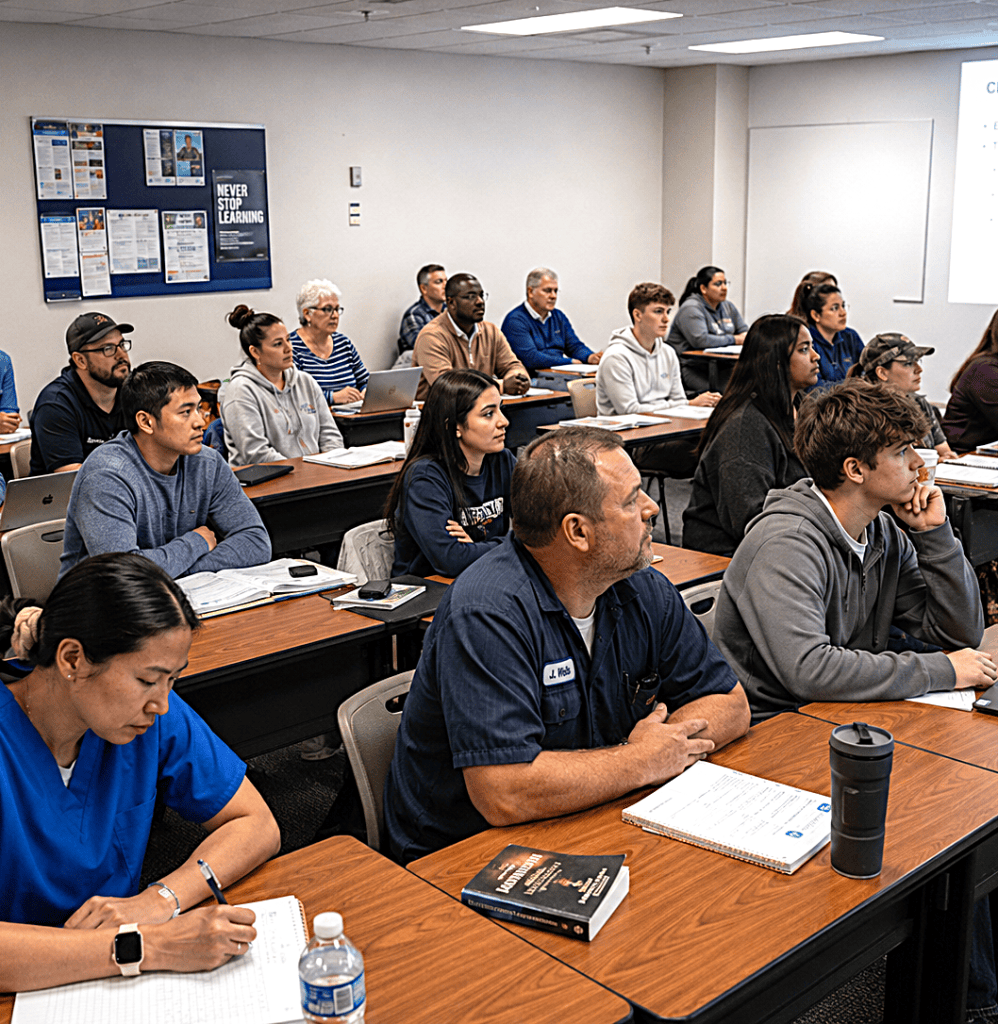
Put together, the new evidence supports a narrower version of the February conclusion. It applies with most force to the middle and high school years, where scores have been flat or falling for more than a decade, absenteeism is high, AI makes it easiest to skip the work of learning, and families with options are leaving. It applies with less force to the early grades, where 2026 brought evidence that public schools can still teach children to read and compute when they adopt proven methods and stay with them.
The Outlook at Home
The near-term calendar is crowded. The federal tax-credit scholarships begin January 1, 2027. Main NAEP reading and math results, which include state-level scores, are due in early 2027 (NAGB, 2026). Dozens of announced closures take effect in the 2026–27 and 2027–28 school years (Merod, 2026).
Three pressures will compound over that period. Fewer births mean fewer students. Expanding choice programs move more of the remaining students out of district schools. And because most state funding follows enrollment while buildings, pensions, and transportation costs do not shrink at the same rate, each lost student leaves the district with less money per remaining student. “Even when enrollment declines, costs to operate the school remain the same,” said Troy Flint of the California School Boards Association, and Kindra Britt of the California County Superintendents said the losses translate “directly into budget deficits, staff layoffs, program cuts, and in some cases, school closures” (Lambert et al., 2026).
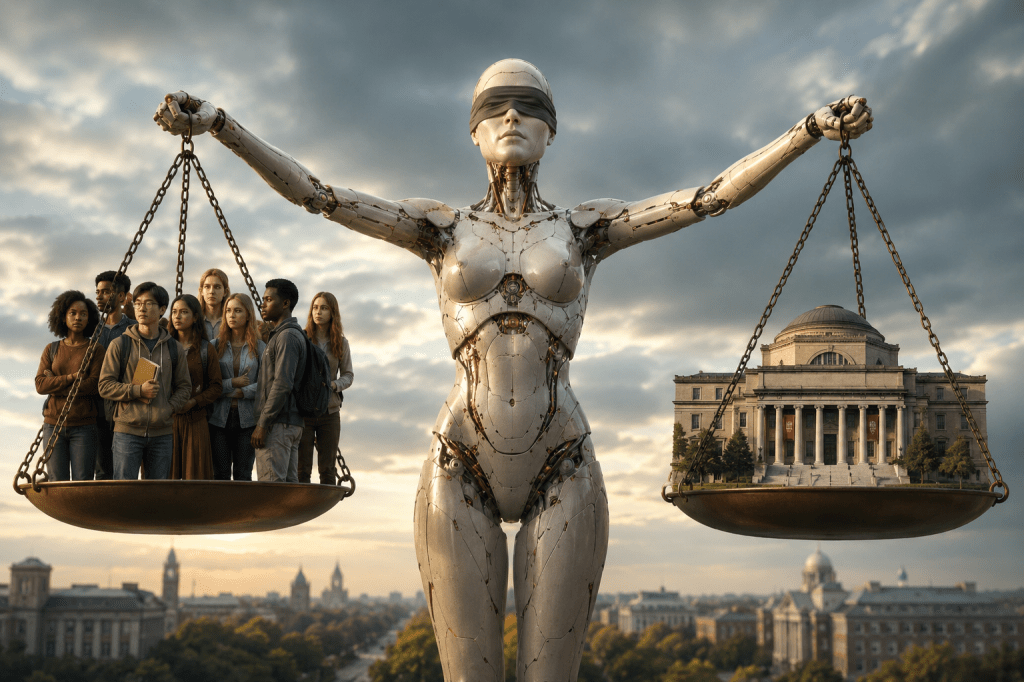
That raises the risk of a two-tier system. About two-thirds of parents remain satisfied with their own children’s education, roughly double the national figure (Associated Press, 2026). Critics of the new tax credit expect it to favor families who already have options. Jon Valant of the Brookings Institution wrote, “It seems much likelier that we come to see the FSTC as a Title I for rich kids,” and Michigan State University researcher Josh Cowen estimated the program would deliver about $112 per public school student nationwide in 2030 (Stone & Prothero, 2026). At the high end of the private market, Alpha School, which uses two hours a day of AI-driven lessons for core subjects, charges $45,000 to $75,000 a year and plans to grow to roughly 50 campuses (Sands, 2026).
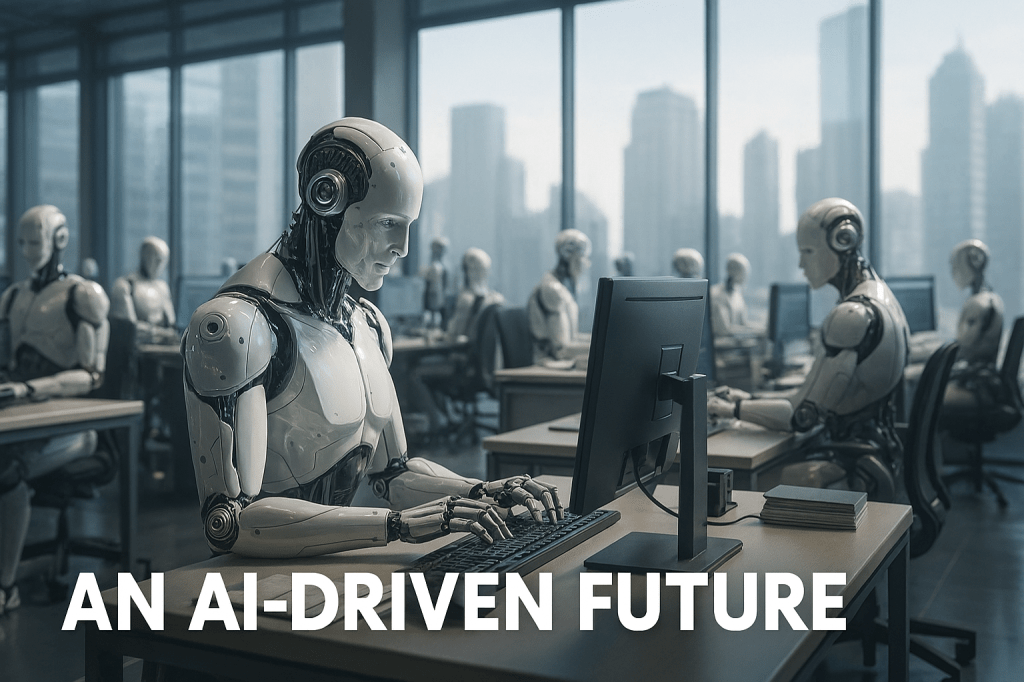
Generative AI is the newest pressure and the one schools are least prepared for. A Common Sense Media survey of 1,017 teens, reported in August, found that “Roughly 7 in 10 teens use AI for academic support.” Sixty-three percent use it to get answers to schoolwork and 25% submit those answers as they are, while 70% said their teachers had never discussed how to use the technology safely (Seshadri, 2026). A Fordham Institute survey found that “48% of high school respondents said they regularly had AI solve math problems for them” (Mahnken, 2026). RAND’s 2025 national surveys found that more than 80% of students said their teachers had not explicitly taught them how to use AI for schoolwork (Doss et al., 2025). University of Washington economist Dan Goldhaber stated the concern: “I worry that it makes some things so easy that people don’t learn those things” (Mahnken, 2026). Schleicher told Euronews that in PISA 2025 students who do not use AI scored higher on average, though the OECD cautions that “these results cannot determine causality” (Walker & Gwyn Jones, 2026; Iftikhar, 2026).
Federal capacity to see and respond to these trends is weaker than it was a year ago. The PISA questionnaire gap is one sign. Another is the state of the Education Department itself, which NPR reported “has become more complex, costly and inefficient” since programs were dispersed across at least nine other federal buildings (Work, 2026; Mehta & Turner, 2026). “This is not efficiency, this is chaos,” said Rachel Gittleman, president of the union local that represents department employees (Mehta & Turner, 2026). Department officials dispute that account and point to more than 7,200 grant payments processed through Labor’s system (Mehta & Turner, 2026).
The Outlook Abroad
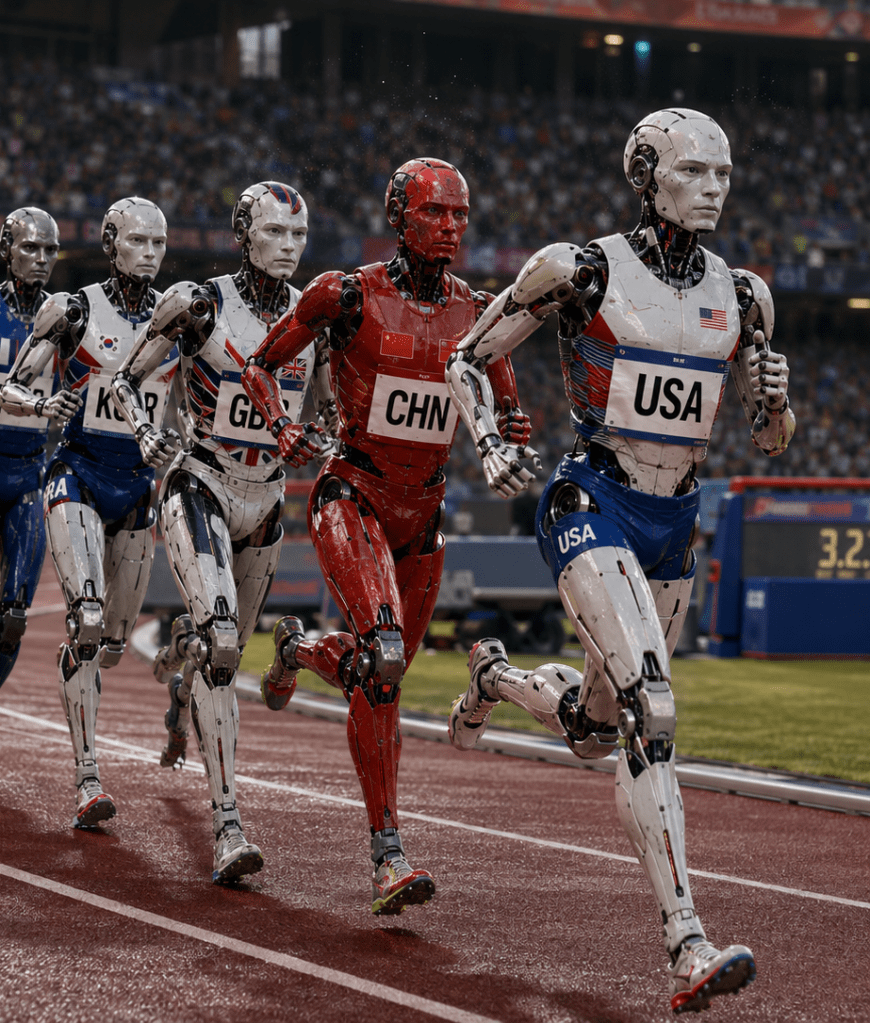
For the rest of the world, the PISA tables are the clearest scoreboard. Students from four affluent Chinese provinces, Beijing, Shanghai, Jiangsu, and Zhejiang, which participate as a single unit and do not represent China as a whole, scored 612 in math and 597 in science, the highest of 91 participants, and 527 in reading, second to Singapore’s 535 (China Daily Hong Kong, 2026). The U.S. math average of 463 is about 150 points lower. Twenty-four countries and economies outscored the United States in math (Mesa, 2026). Singapore reported that 15% of its students were top performers in all three core subjects, against an OECD average of 3% (Ministry of Education Singapore, 2026). On the TIMSS international math assessment, U.S. eighth-grade scores fell 27 points between 2019 and 2023 (National Science Board, 2026).
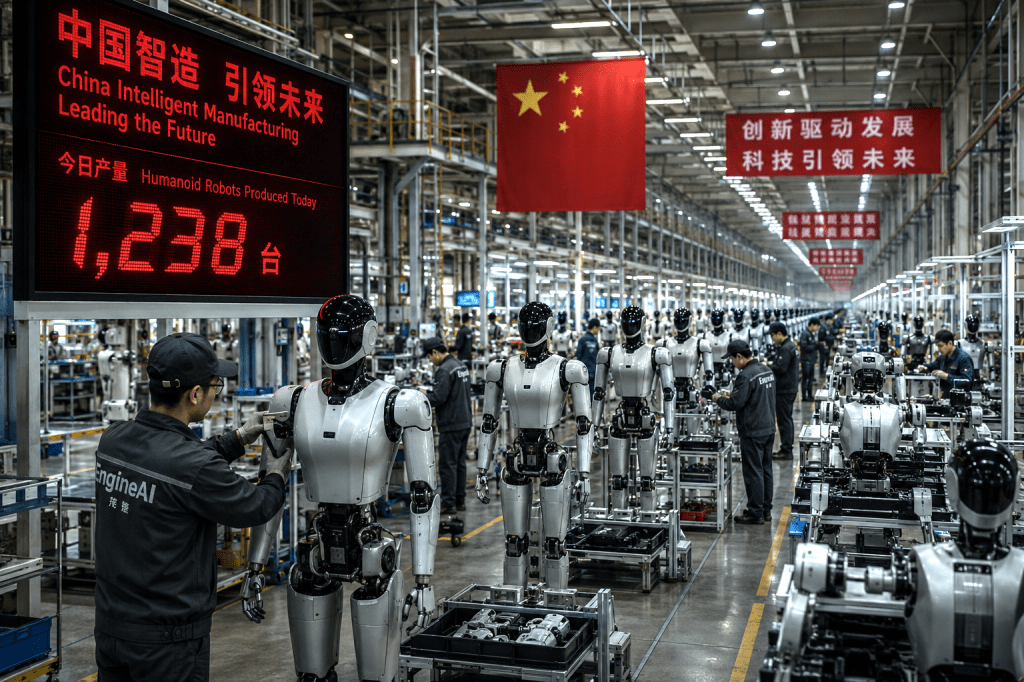
The leading systems are also moving faster on AI in schools. In April, China’s Ministry of Education announced plans to build, by 2030, “a comprehensive AI education system that spans all levels of schooling and extends to the broader public,” including dedicated AI courses in primary and secondary schools (Xinhua, 2026). Singapore’s students use AI heavily, 66% weekly for learning, and 81% said their schools teach them how to assess the quality of AI-generated information, compared with 63% across the OECD (Iftikhar, 2026). In the Chinese provinces, about 83% of students attend schools that ban phones on the premises, and only 5% said classmates were distracted by devices in most science lessons, against 28% across the OECD (Iftikhar, 2026). The United States has a 2025 executive order promoting AI literacy in K-12 schools (The White House, 2025), but carrying it out is left to states and districts, and the Common Sense survey suggests most classrooms have not yet taken it up (Seshadri, 2026).
The United States has long made up for uneven school results by importing talent. Foreign-born workers made up 22% of the 37 million people in U.S. science, technology, engineering, and math jobs in 2024, and 28% of workers in science and engineering occupations (National Science Board, 2026). China awarded about 53,000 science and engineering doctorates in 2022, more than any other country; the United States awarded about 45,000 in 2023 (National Science Board, 2026). That import channel is narrowing. New international student enrollment at U.S. colleges fell 17% in fall 2025 (Nash, 2025), and NAFSA projects that overall international enrollment will fall about 9.5% this fall, a loss of up to 110,000 students (ICEF Monitor, 2026). If domestic preparation weakens while the flow of foreign talent slows, the two main sources of skilled workers shrink at the same time. McMahon has described the workforce side of the problem: “For every five that are leaving the workforce now, only two are coming back in” (Work, 2026).
PISA measures 15-year-olds, and today’s 15-year-olds will make up much of the American workforce in the 2030s and 2040s. Vicki Phillips, head of the National Center on Education and the Economy, said the decline in skills “will increasingly shape individual opportunity and a country’s ability to innovate, adapt, and grow” (Mahnken, 2026). Burns put the question to the United States directly: “Is it able to deliver on the aspirations that the U.S. holds as the world’s major economic power?” (Barnum & Meltzer, 2026).
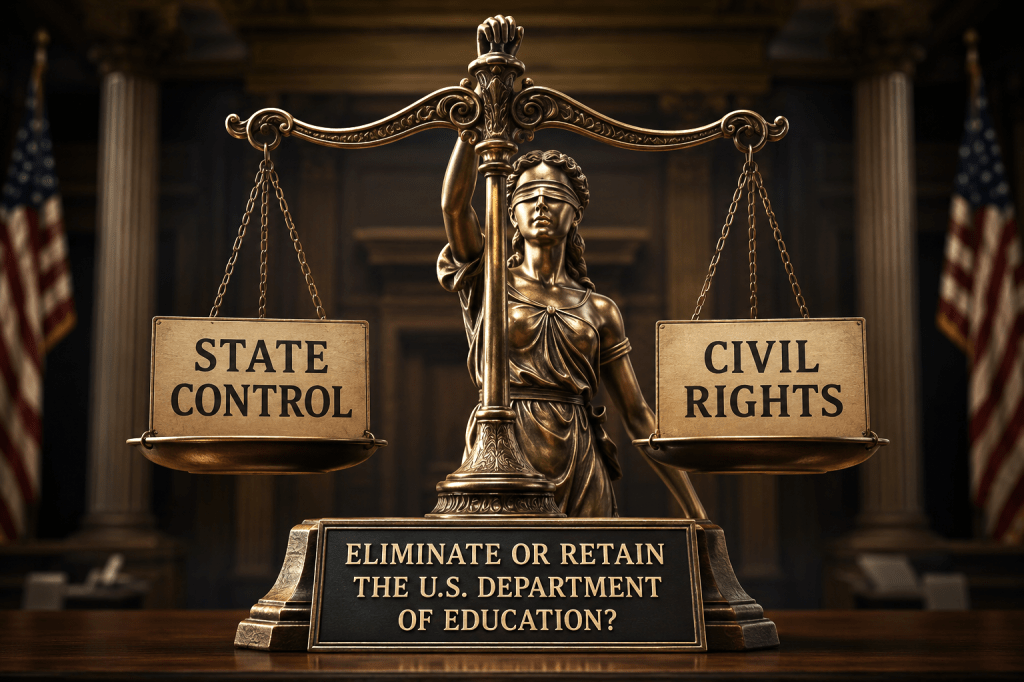
Fix It or Replace It?
Assuming that this trajectory is dire, the case for fixing the existing system rests on scale and evidence. About 43 million students attended traditional public schools in 2023–24 (Shimabukuro, 2026b), and no alternative is close to serving them. The typical private microschool enrolls about 20 students, and RAND has called it “nearly impossible” to measure the sector’s academic impact (Jacobson, 2026). Alpha’s New York City campus expects to grow from 22 to 160 students this year, at tuition of $45,000 or more, and Penn State professor Gerald LeTendre, commenting on AI-centered schooling, said, “Right now we’re conducting a gigantic experiment on the human population” (Sands, 2026). The test-score evidence on vouchers is mixed. Even Jay Greene, a prominent supporter, acknowledged that a decline in Louisiana’s program “is large and across-the-board,” while arguing that the benefits of choice show up in later outcomes such as graduation (Greene, 2017). And the most convincing gains of the past three years came from public systems in Mississippi, Tennessee, Baltimore, and Washington, D.C.
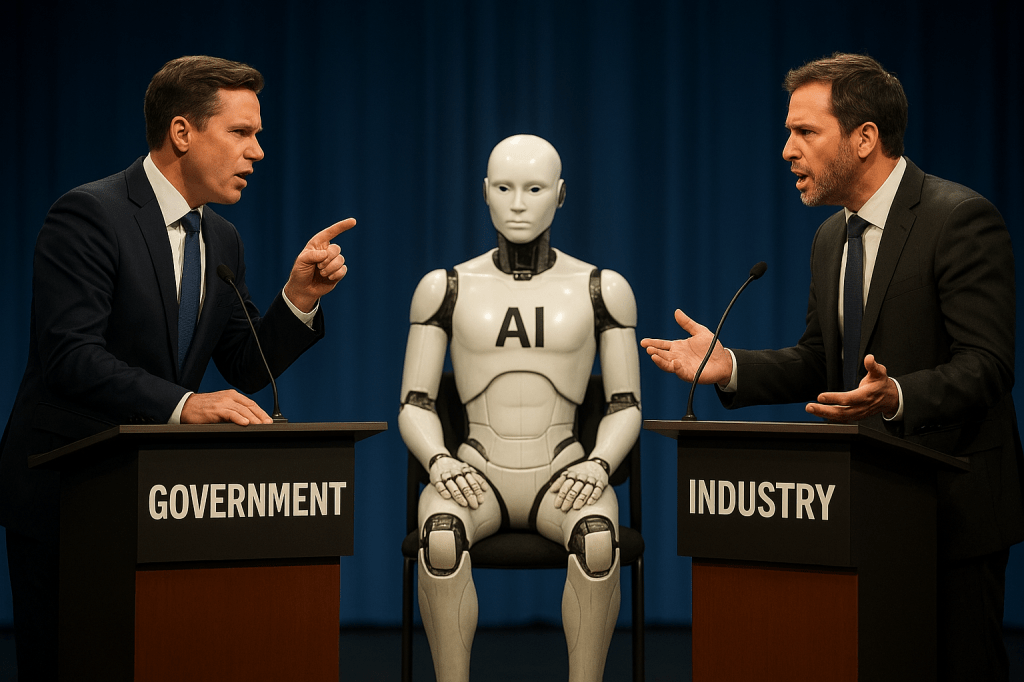
The case for replacement rests on duration and change in the world outside school. Adolescent achievement has fallen or stalled for more than a decade through several rounds of reform. Satisfaction is at a record low, and families are leaving. And AI has made the core routine of secondary school, assigning essays and problem sets to be done at home and graded later, easy to complete without learning anything. Frances Messano, chief executive of NewSchools Venture Fund, wrote in May that the schools she highlights “are not incremental adjustments to the factory model” and asked what it would look like to treat this moment “with the urgency of a Marshall Plan for education” (Messano, 2026). In a Deseret Magazine debate, Kerry McDonald of the Foundation for Economic Education argued that “To thrive in the economy of tomorrow, children need to learn how to both harness and rise above the robotic,” while Daniel Buck of AEI answered that “The best way to understand the classroom frames it as an updated tradition” (Braylovskiy, 2026). CRPE’s October blueprint staked out the middle: “Burning down the public education system is not the answer, but neither is blindly defending the status quo” (Wolfe & Lake, 2026).
ETC Journal’s answer separates three layers that the fix-or-replace debate tends to treat as one. The first is the public commitment: public funding, open access for every child, and public accountability for results. The evidence of 2026 gives no reason to abandon it, and the alternatives cannot yet carry the load. The second is the elementary core. Here the evidence favors repair, using methods that have now worked in several states: structured reading instruction, coaching, tutoring, and attendance. The third is the operating model of the middle and high school years: students grouped by age, credit earned by time spent in class, a fixed bell schedule, and take-home work as the main proof of learning. This layer should be replaced. It has shown the weakest results for the longest time, and AI has undercut its main method of checking whether students have learned.
Replacement is already under way in an unplanned form. Choice programs, closures, microschools, and private AI schools are pulling students out of the existing model one family at a time, mostly families with money or information. The policy choice for states is whether the replacement will be designed, with public standards and public reporting, or left to happen by default.
What a Replacement Must Do
If the secondary model is replaced, eight requirements matter most, and each has a working example somewhere. First, every child must have secure reading and math skills by about age 10. This is the foundation the rest depends on, and the methods are known. Mississippi’s 2013 reading law and its 2026 extension into math, Tennessee’s literacy reforms, and Baltimore’s phonics curriculum all show the same pattern: a statewide or districtwide curriculum, trained coaches in classrooms, and sustained commitment over many years (Bose et al., 2026; Tennessee Department of Education, 2026; Turner, 2026).
Second, students should advance by demonstrating what they can do. CRPE’s blueprint urges states to rethink graduation requirements for the AI era and to treat grades 11 through 14 as one continuous transition into college or training (Wolfe & Lake, 2026). At Discovery Polytech Early College High School, a district school in Springfield, Massachusetts, “learning is organized around interdisciplinary, project-based experiences connected to real-world problems,” and students are assessed through portfolios, public presentations, and exhibitions (Messano, 2026). Work produced in front of a teacher or an audience is much harder to hand off to a chatbot than a take-home essay.
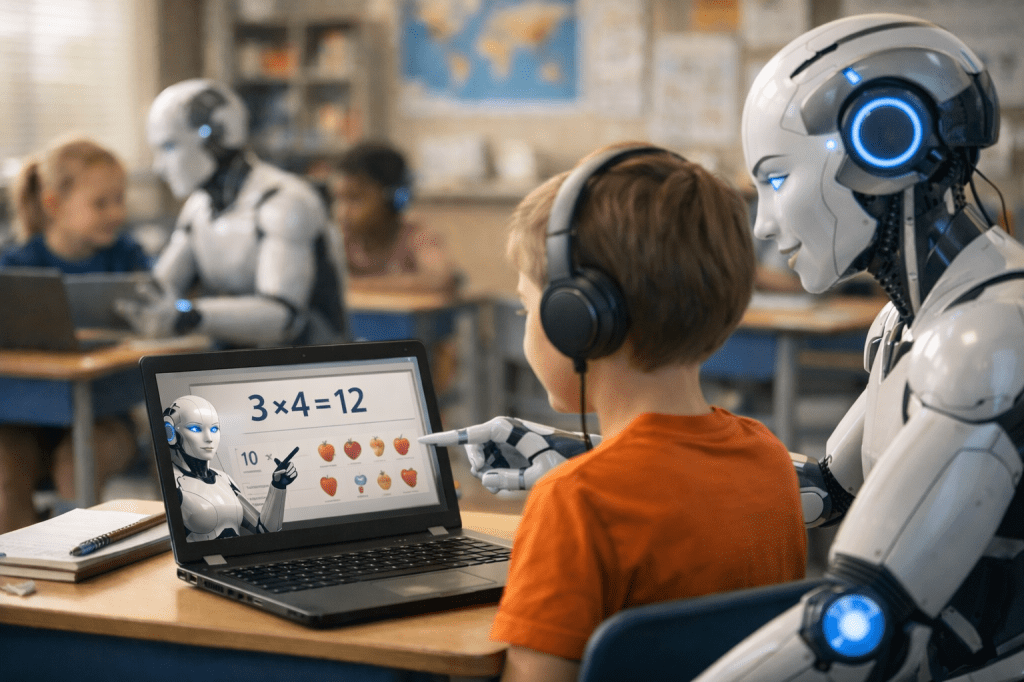
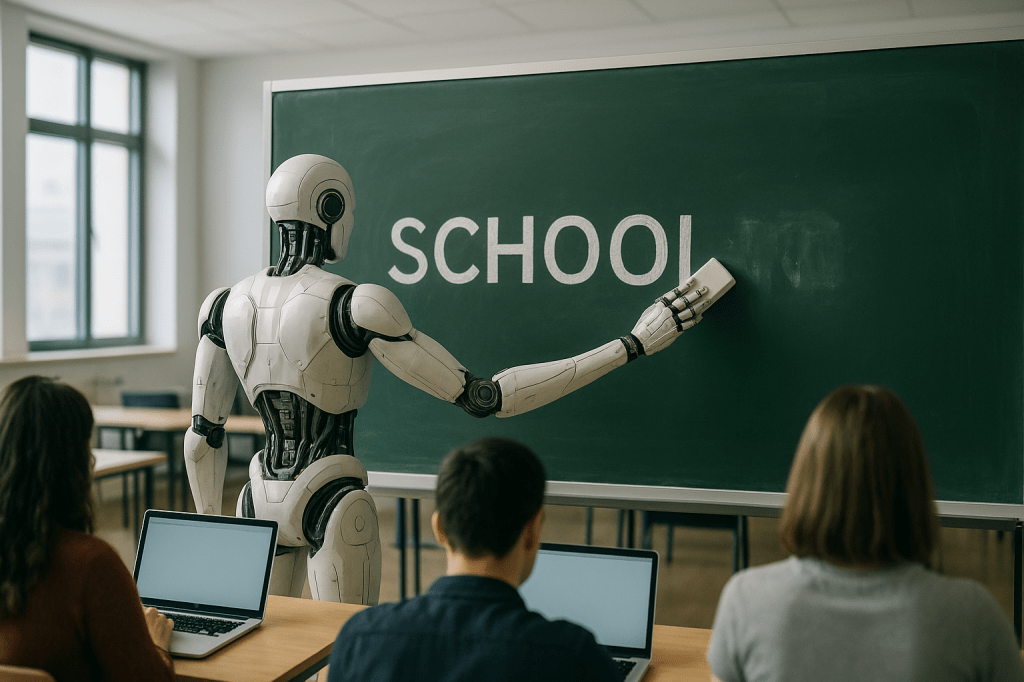
Third, AI should work as a coach that asks questions, and students should be taught to judge it. Estonia offers the clearest national example. Its AI Leap program gives students a learning app that asks guiding questions, such as what an essay is for, before it helps; in the program’s own words, the AI “becomes a smart coach rather than a smart servant” (e-Estonia, 2026). By January 2026, more than 100 of Estonia’s 154 upper-secondary schools had the app (e-Estonia, 2026). “The brain doesn’t develop if we don’t train it,” said Ivo Visak, who leads the program (e-Estonia, 2026). Estonia ranked first in Europe on PISA 2025 and in the global top ten in all three tested subjects (Walker & Gwyn Jones, 2026). The OECD warns that “Simply expanding access to AI tools is unlikely to produce benefits without parallel investments in guidance” (Iftikhar, 2026), and Schleicher urged schools to move students from consuming AI output to using AI creatively (Walker & Gwyn Jones, 2026).
Fourth, schools must protect attention and attendance. By March 2026, 33 states had enacted laws limiting student cellphone use in K-12 schools, Kansas among them with a full school-day ban (Ballotpedia News, 2026). The top-scoring Chinese provinces pair widespread phone bans with very low reported classroom distraction (Iftikhar, 2026). On attendance, New York City now requires every school to name a “school avoidance liaison” for students missing school because of anxiety, depression, or similar conditions (Zimmer, 2026). Malkus argues that schools and parents together must rebuild a “culture of regular attendance” (Altavena, 2026b).
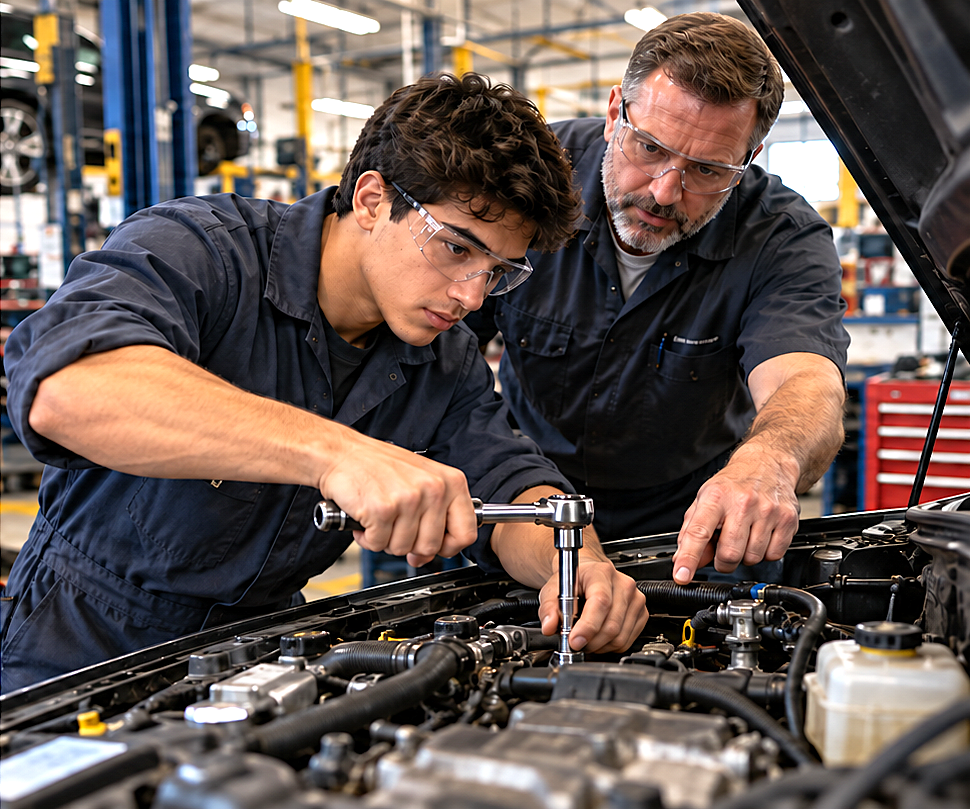
Fifth, the teenage years should connect directly to adult work. In Switzerland, nearly two-thirds of 16- to 18-year-olds take part in apprenticeships that combine paid work with one or two days of classroom study each week. In Indiana, a coalition of nearly 200 business and education leaders modeled a plan on the Swiss design, with the goal of serving a cumulative 50,000 youth apprentices by 2034 (Smith, 2024). In St. Louis, BELIEVE Academy, a charter school that opened in 2024, pairs academics with health care training, simulation labs, industry certifications, and college credit through partners including BJC HealthCare (Messano, 2026).
Sixth, teaching should become a team profession. The shortage of about 425,000 fully qualified teachers will not be closed by recruiting alone (Learning Policy Institute, 2026). CRPE recommends team-based staffing (Wolfe & Lake, 2026). In the Internationals Network schools, teams of five or six teachers share a group of 75 to 100 newly arrived multilingual students and meet regularly to plan for them together (Messano, 2026). Teams allow novices to work alongside experienced teachers and let schools add specialists, tutors, and AI tools around a shared group of students.
Seventh, public money must come with public accountability, wherever students enroll. If funding follows students to charters, private schools, microschools, and scholarship programs, then results, costs, and admissions practices must be reported in comparable public form. CRPE calls for unified enrollment systems and transportation subsidies so that low-income students can actually use their options (Wolfe & Lake, 2026). Without those protections, Valant’s “Title I for rich kids” becomes the likely outcome (Stone & Prothero, 2026). Accountability also requires reliable national data, which the gaps in the 2025 PISA sample show cannot be taken for granted (Barnum & Meltzer, 2026).
Eighth, families must be treated as partners in learning. PISA 2025 found that students whose parents regularly ask about their school day score, on average, about two school years ahead of those whose parents do not (Walker & Gwyn Jones, 2026). That is a correlation, but it is consistent with the attendance data: in AEI’s survey, 60% of parents said absenteeism was a problem at other schools, while only 28% said it was a problem at their own child’s school (Altavena, 2026b). Any new model has to close that gap between what parents believe about schools in general and what they see at home.
Eight Months On
The February conclusion asked whether American public schools ever served “the full range of human learning potential.” The data released since then give a more specific answer. The system made large gains from 1990 to 2013, lost ground after 2013, lost more during the pandemic, and is now losing students, money, and public confidence at once. The losses are deepest in the adolescent years, where the bell-schedule, seat-time model is weakest and where AI has done the most to undermine it. The early grades show that public schools can still improve quickly when states commit to proven methods.
That points to a dual course for the next several years: repair the elementary core, replace the secondary model, and keep the public commitment that pays for both. The timeline is short. Federal tax-credit scholarships start in January, new state-by-state NAEP scores arrive early next year, and closures already approved take effect in 2027. Kane’s assessment from May still frames the task: “The recovery of U.S. education has begun. But it’s up to the rest of us to spread it” (Harvard CEPR, 2026).
References
Altavena, L. (2026a, June 10). New NAEP scores offer optimism for younger students but warning signs for teens. Chalkbeat. https://www.chalkbeat.org/2026/06/10/new-naep-scores-show-older-students-struggling-in-reading-and-math/
Altavena, L. (2026b, June 30). 4 numbers that show how chronic absenteeism is becoming a long-term crisis. Chalkbeat. https://www.chalkbeat.org/2026/06/30/chronic-absenteeism-crisis-not-just-due-to-pandemic-study-finds/
Associated Press. (2026, September 8). Americans’ satisfaction with schools is at a low point, new Gallup poll shows. WCAX. https://www.wcax.com/2026/09/08/americans-satisfaction-with-schools-is-low-point-new-gallup-poll-shows/
Ballotpedia News. (2026, March 26). Kansas becomes thirty-third state to enact a K-12 cellphone ban. https://news.ballotpedia.org/2026/03/26/kansas-becomes-thirty-third-state-to-enact-a-k-12-cellphone-ban/
Barnum, M., & Meltzer, E. (2026, September 8). U.S. moves up in PISA test score rankings because other countries are doing worse. Chalkbeat. https://www.chalkbeat.org/2026/09/08/pisa-results-2025-show-us-gaining-as-other-countries-decline/
Bose, D., Lurye, S., Gecker, J., Altavena, L., & Smith, R. S. (2026, May 13). Mississippi’s education gains continue amid a nationwide “reading recession,” report says. Mississippi Today. https://mississippitoday.org/2026/05/13/reading-mississippi-gains-pandemic/
Braylovskiy, V. (2026, August 31). Should we rethink K-12 education? Deseret Magazine. https://www.deseret.com/magazine/2026/08/31/exploring-the-future-of-education/
China Daily Hong Kong. (2026, September 10). Chinese students lead global rankings in 2025 PISA. https://www.chinadailyhk.com/article/639362
Doss, C. J., Bozick, R., Schwartz, H. L., Chu, L., Rainey, L. R., Woo, A., Reich, J., & Dukes, J. (2025). AI use in schools is quickly increasing but guidance lags behind: Findings from the RAND survey panels (RR-A4180-1). RAND. https://www.rand.org/pubs/research_reports/RRA4180-1.html
e-Estonia. (2026, February 18). Estonia’s AI Leap: Learning to think in the AI age. https://e-estonia.com/estonias-ai-leap-learning-to-think-in-the-ai-age/
Greene, J. P. (2017, April 28). If you mostly care about test scores, private school choice is not for you. Education Next. https://www.educationnext.org/mostly-care-test-scores-private-school-choice-not/
Harvard Center for Education Policy Research. (2026). Education Scorecard. https://cepr.harvard.edu/education-recovery-scorecard
ICEF Monitor. (2026, August 11). Visa delays and policy uncertainty projected to reduce foreign enrolment in the US by more than 100,000 students this fall. https://monitor.icef.com/2026/08/visa-delays-and-policy-uncertainty-projected-to-reduce-foreign-enrolment-in-the-us-by-more-than-100000-students-this-fall/
Iftikhar, F. (2026, September 9). China’s PISA toppers use less AI. Singapore uses more. Both score high—what’s the lesson? ThePrint. https://theprint.in/india/education/chinas-pisa-toppers-use-less-ai-singapore-uses-more-both-score-high-whats-the-lesson/3038191/
Jacobson, L. (2026, June 11). Exclusive: 7 things to know about microschools in 2026. The 74. https://www.the74million.org/article/exclusive-7-things-to-know-about-microschools-in-2026/
Lambert, D., Thornton, L., Fensterwald, J., & Willis, D. J. (2026, April 17). California schools face budget cuts as enrollment drops by 74,961 students. EdSource. https://edsource.org/2026/declining-school-enrollment-california/756174
Learning Policy Institute. (2026, July 13). State teacher shortages 2026 [Fact sheet]. https://learningpolicyinstitute.org/product/state-teacher-shortages-2026-factsheet
Mahnken, K. (2026, September 10). Global test scores hit new lows—just as AI takes hold in schools. The 74. https://www.the74million.org/article/global-test-scores-hit-new-lows-just-as-ai-takes-hold-in-schools/
Mehta, J., & Turner, C. (2026, September 24). The Education Department hasn’t been dismantled. It’s become more inefficient, staff say. NPR (via OPB). https://www.opb.org/article/2026/09/24/education-department-inefficient/
Meltzer, E. (2025, September 9). NAEP scores for class of 2024 show major declines, with fewer students college ready. Chalkbeat. https://www.chalkbeat.org/2025/09/09/naep-scores-12th-grade-math-reading-declines
Merod, A. (2026, October 9). As student enrollment declines, a look at public school closures. K-12 Dive. https://www.k12dive.com/news/public-schools-closure-tracker-enrollment/809364/
Mesa, J. (2026, September 8). Map shows which countries outscore US in reading and math. Newsweek. https://www.newsweek.com/map-shows-which-countries-outscore-us-in-reading-and-math-12416556
Messano, F. (2026, May 4). What are schools for now? Stanford Social Innovation Review. https://ssir.org/articles/entry/messano-what-are-schools-for-now
Ministry of Education Singapore. (2026, September 8). PISA 2025: Singapore students demonstrate strong real-world problem-solving skills in computational thinking domain [Press release]. https://www.moe.gov.sg/news/press-releases/20260908-pisa-2025-singapore-students-demonstrate-strong-real-world-problem-solving-skills-in-computational-thinking-domain
Nash, P. (2025, November 17). New international enrolments in US down 17% this fall. The PIE News. https://thepienews.com/new-international-enrolments-in-us-down-17-this-fall/
National Assessment Governing Board. (2026, June 10). NAEP long-term trend assessments show different trends for 9- and 13-year-olds [News release]. https://www.nagb.gov/news-and-events/news-releases/2026/naep-long-term-trend-assessments-show-different-trends-for-9-and-13-year-olds.html
National Science Board. (2026). The state of U.S. science and engineering 2026 (NSB-SEP-2026-1). National Center for Science and Engineering Statistics. https://ncses.nsf.gov/pubs/nsbsep20261/stem-talent-education-training-and-workforce-2
Schneider, J. (2015). American schools are modeled after factories and treat students like widgets. Right? Wrong. Holy Cross Magazine (originally published in The Washington Post). https://magazine.holycross.edu/stories/american-schools-are-modeled-after-factories-and-treat-students-widgets-right-wrong
Seshadri, M. (2026, August 18). Teens use AI for academic support even though they see the dangers, survey finds. EdSource. https://edsource.org/2026/teens-use-ai-schoolwork/764243
Shimabukuro, J. (2026a, February 13). Status of U.S. public schools in 2026: “Slow, uneven decline.” ETC Journal. https://etcjournal.com/2026/02/13/status-of-u-s-public-schools-in-2026-slow-uneven-decline/
Shimabukuro, J. (2026b, February 13). The decline of U.S. public education began in 1967. ETC Journal. https://etcjournal.com/2026/02/13/the-decline-of-u-s-public-education-began-in-1967/
Smith, C. (2024, September 17). Indiana’s industry leaders unveil new statewide apprenticeship plan to train thousands of Hoosiers. Indiana Capital Chronicle. https://indianacapitalchronicle.com/2024/09/17/indianas-industry-leaders-unveil-new-statewide-apprenticeship-plan-to-train-thousands-of-hoosiers/
Stone, M., & Prothero, A. (2026, October 14). Democratic holdouts still aren’t committing to Trump’s school choice program. Education Week. https://www.edweek.org/policy-politics/democratic-holdouts-still-arent-committing-to-trumps-school-choice-program/2026/10
Tennessee Department of Education. (2026, May 13). Tennessee recognized as national leader in academic recovery in new Education Scorecard report [News release]. https://www.tn.gov/education/news/2026/5/13/tennessee-recognized-as-national-leader-in-academic-recovery-in-new-education-scorecard-report-.html
The White House. (2025, April 23). Advancing artificial intelligence education for American youth [Executive order]. https://www.whitehouse.gov/presidential-actions/2025/04/advancing-artificial-intelligence-education-for-american-youth/
Turner, C. (2026, May 13). Kids’ test scores began declining way before COVID. These schools are making gains. NPR (via WAMC). https://www.wamc.org/2026-05-13/kids-test-scores-began-declining-way-before-covid-these-schools-are-making-gains
Walker, L., & Gwyn Jones, M. (2026, September 10). PISA-Gründer: Junge Menschen verlieren Kernkompetenzen, KI höhlt Fähigkeiten aus [PISA founder: Young people are losing core skills; AI hollows out abilities]. Euronews. https://de.euronews.com/2026/09/10/pisa-grunder-junge-menschen-verlieren-kernkompetenzen-ki-hohlt-fahigkeiten-aus
Webster-Bass, T. (2026, September 9). Florida’s public school enrollment falls while vouchers soar. The Florida Trib. https://floridatrib.org/2026/09/09/floridas-public-school-enrollment-falls-while-vouchers-soar/
Wolfe, R. E., & Lake, R. (2026, October 8). Phoenix rising: Bold ideas for states to transform public education. Center on Reinventing Public Education. https://crpe.org/phoenix-rising-bold-ideas-for-states-to-transform-public-education/
Work, M. C. (2026, October 15). Education Secretary McMahon promotes tech training, defends budget cuts in Rochester visit. MPR News. https://mprnews.org/story/2026/10/15/education-secretary-linda-mcmahon-defends-budget-cuts-during-minnesota-visit
Xinhua. (2026, April 10). China moves to bring AI into classrooms as it accelerates digital push. The State Council of the People’s Republic of China. https://english.www.gov.cn/news/202604/10/content_WS69d8910dc6d00ca5f9a0a554.html
Zimmer, A. (2026, September 17). 1 in 3 NYC students chronically absent as rates remain stubbornly high. Chalkbeat New York. https://www.chalkbeat.org/newyork/2026/09/17/nyc-chronic-absenteeism-rates-stubbornly-high/
###
Filed under: Uncategorized |



































































































































































































































































































































































Leave a Reply